

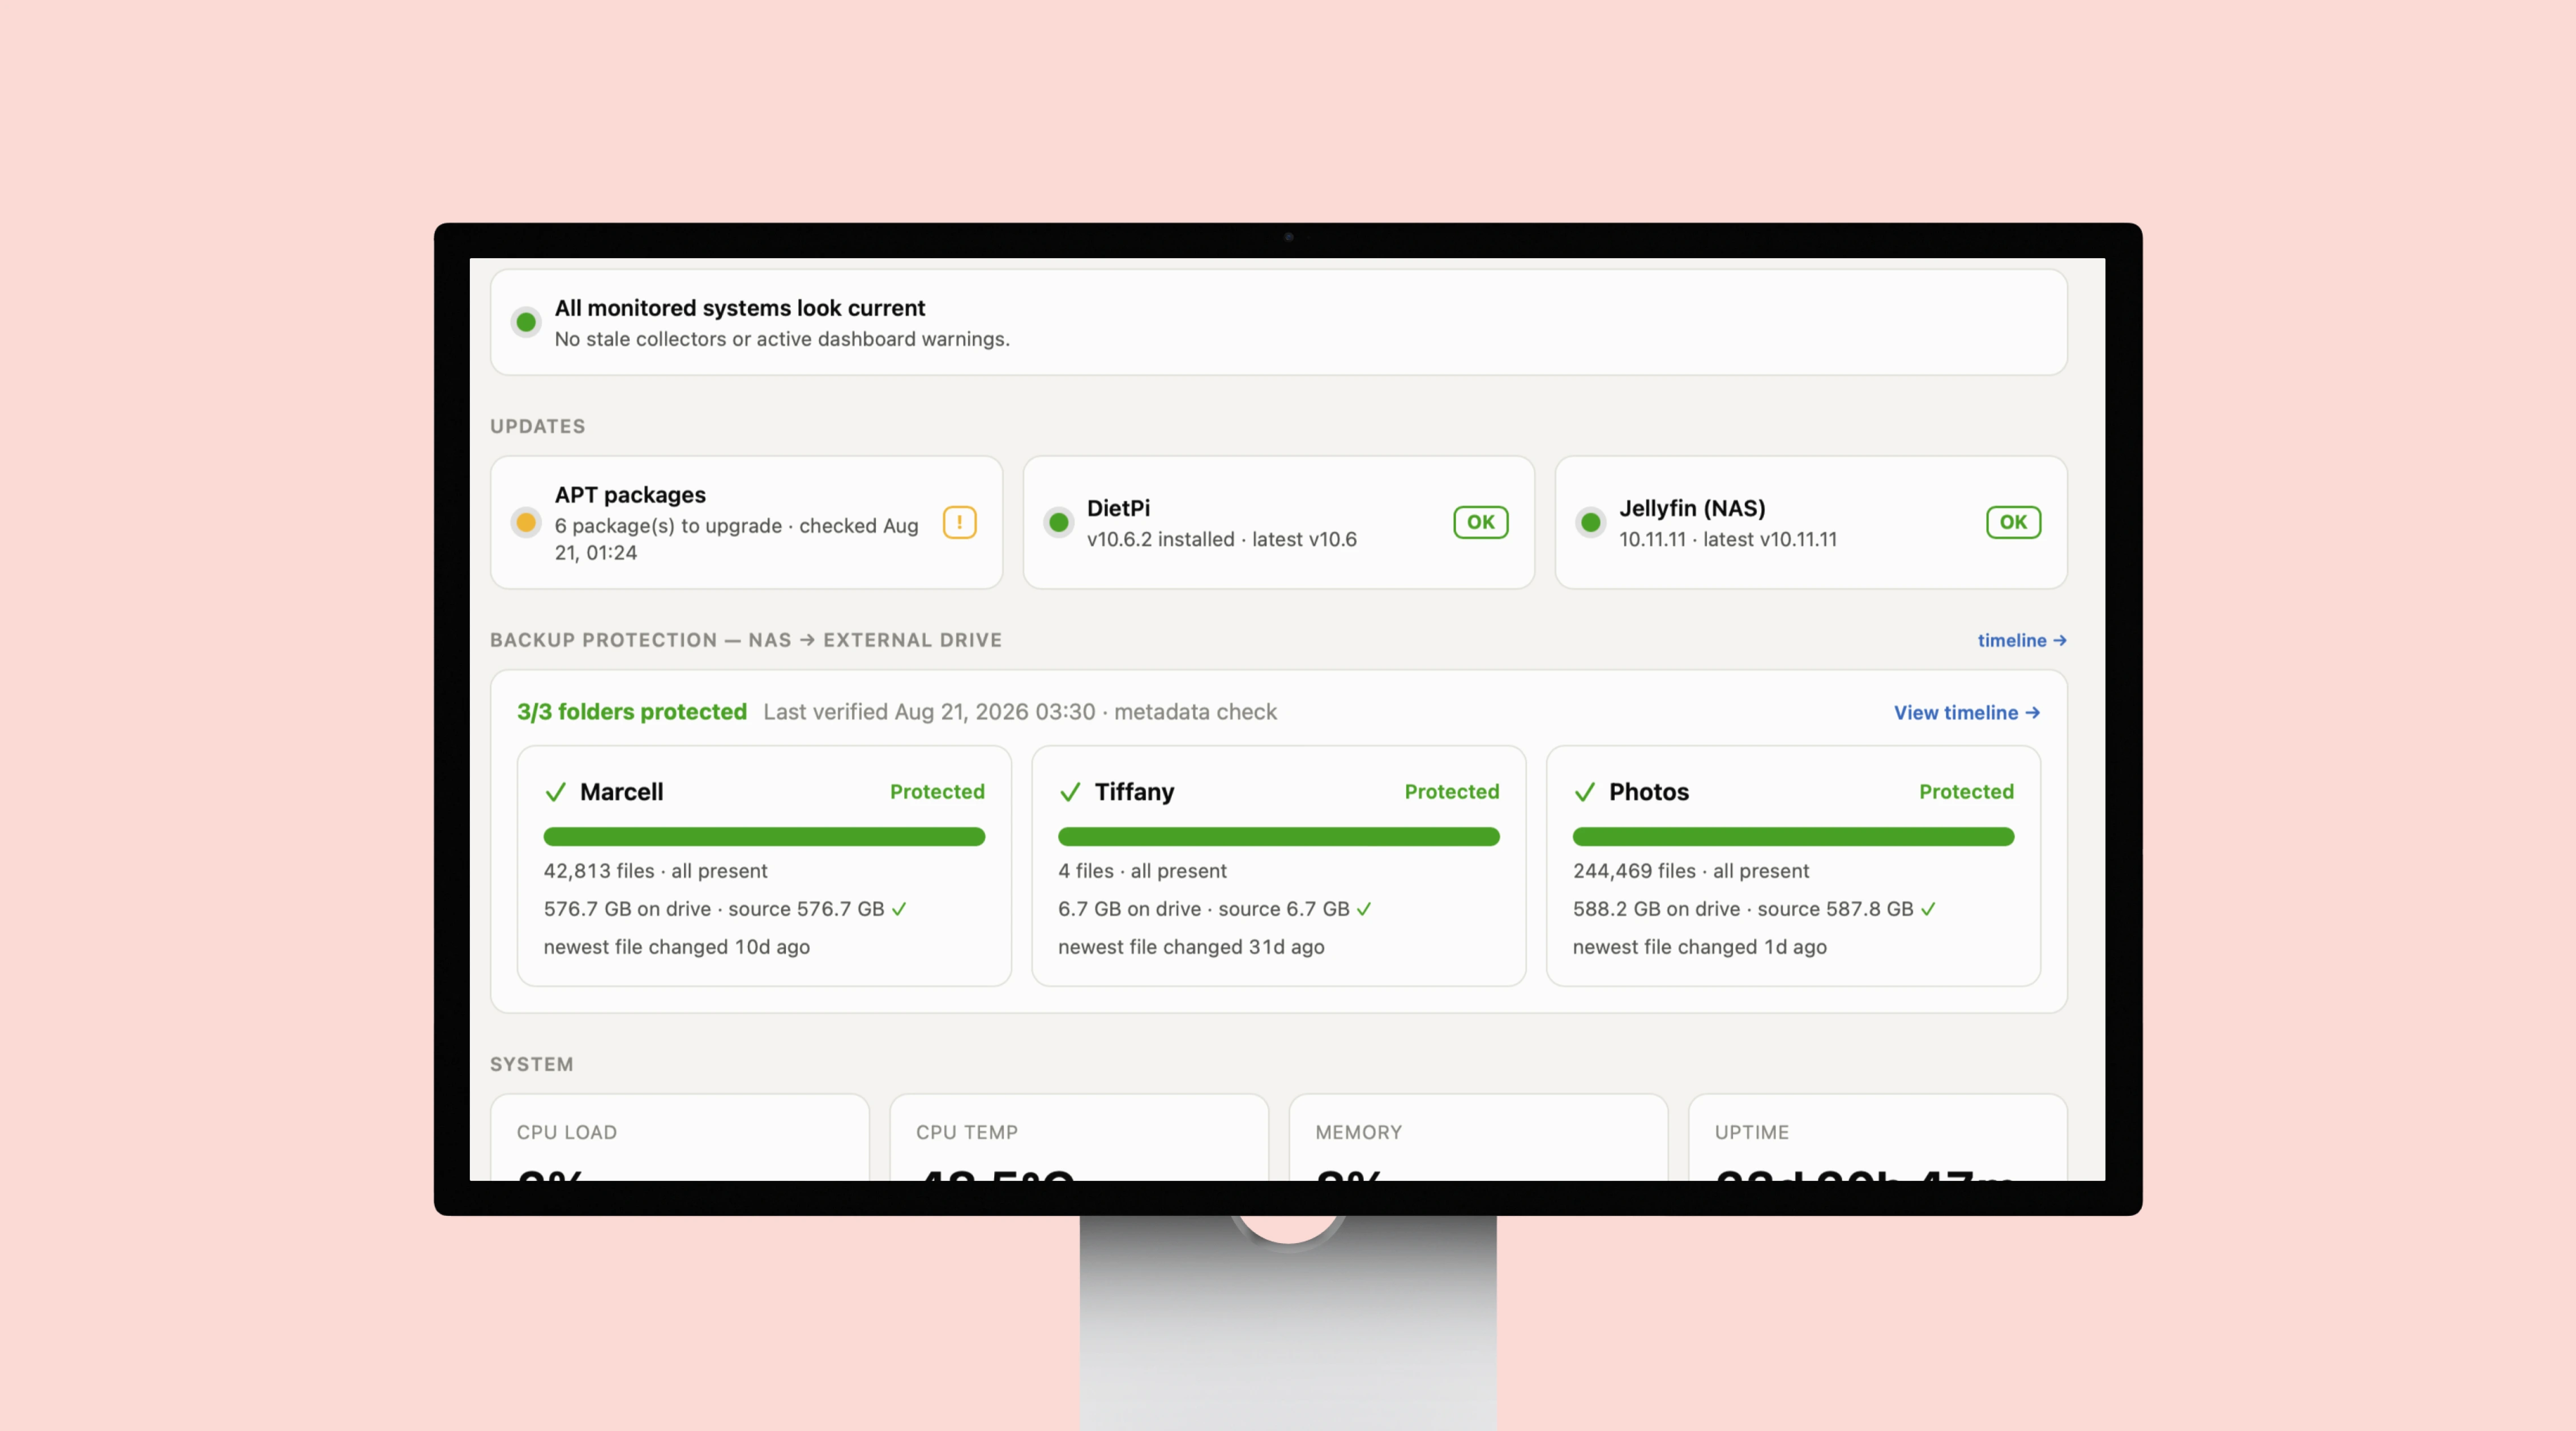
Pi Dashboard
- Design, build, and operation
- 1 week to build · ongoing since Jul 2026
- Solo · AI as a working partner
A local status page for my homelab. It watches a Raspberry Pi, an Unraid NAS, and a Jellyfin VM. It checks whether backups finished, reads drive health, and estimates what the GPUs cost me in electricity. It runs on my network and replaces the five SSH sessions I used to open.
7
60s
0
The dashboard starts with what needs me.
Attention first, then updates
First I see whether every collector is current and whether anything needs attention. That green line matters because it tells me the rest of the page is safe to read.
Backups come next, with file and byte totals checked against the source. A job can exit cleanly and still copy nothing.
Drive health, in the language SMART uses
PASSED, temperature, reallocated and pending sectors, powered-on hours. No invented health score sitting on top of it.
If a value is unavailable, such as bad-sector counts on the NVMe drive, the dashboard shows a question mark. Showing zero would look like good news.
The GPUs, and what they cost
Load, VRAM, temperature, power draw and fan, per card, across both hosts. Underneath, the running energy record and an estimated cost shown as a range.
Idle draw is the number I actually wanted. Roughly 15 W per card, all day, is what a homelab costs when nobody is using it.
Deeper views behind the summary
The front page answers the four questions. The energy page, backup timeline, and full SMART history sit one click away.
Devices can be renamed to something human, because “an unrecognised MAC address on the network” is not a useful sentence.
The only write endpoint in the whole service is that rename.
It started with Pi-hole. Then the commands began piling up.
I bought the Pi to filter DNS and learn more about my network. Soon I was using it to check backups, storage, drive health, and which machine was running what. Every useful command became another thing I had to remember.
I kept thinking, I should put that on the dashboard.
The data was there. It was scattered across machines, command lines, and tools that never showed the whole picture.
I was building this for myself, which made it easy to keep adding things. The harder part was deciding what deserved the front page.
How can one page tell me what needs attention, what changed, and whether the data is still current?
What I needed from it
A quick check before work, after a backup, or whenever a fan spun up. No terminal archaeology. No made-up health score. Just enough context to decide whether I needed to act.
I could check every piece. I just could not check them together.
The answers existed, but each lived behind a different command on a different machine. I wanted one page to tell me: is anything broken, did the backups finish, are the drives healthy, and what are the GPUs doing when nobody is using them?
Where everything lived

Four machines, four different ways of asking
The Pi knew its own load and temperature. The NAS knew about the array and the GPU. The Jellyfin VM knew about transcoding. The backup drive knew whether last night ran. None of them knew about each other.
What that cost:
Remembering which command answered which question, on which host
No way to see whether a problem was one machine or all of them
Checking took long enough that I mostly did not bother until something broke
The four questions
Everything on the page had to earn its place against one of these
I wrote them down before building anything, and they became the filter. If a panel did not help answer one of the four, it did not go on the front page.
What I actually wanted to know:
Is anything broken right now?
Did the backups really finish?
Is the hard drive healthy?
What are the GPUs doing when nobody is using them?
Seven small jobs collect the data. One page pulls it together.
Each collector runs on the schedule its data deserves: temperatures often, SMART data less often, tariffs monthly. They write to one local store, and a Python generator rebuilds the page every 60 seconds.
Cadence per collector
Drives do not change minute to minute. Containers do.
Seven systemd timers, each picked to match how fast the underlying thing moves. Running everything at the fastest interval would cost more and tell me nothing extra.
The schedule:
Dashboard generation every minute · Docker every 2 · alerts every 5 · network scan every 10
SMART hourly, because drive health does not change faster than that
Backup verification daily, checksum verification monthly
Live metrics read at generation time from /proc and /sys, Jellyfin’s HTTP API, and the GPUs over SSH
How it stores and serves
SQLite for history, JSON for right now, static HTML for the page
Two stores because they answer different questions. History has to survive restarts and be queryable over years; current state only has to be correct this minute and get handed between collectors.
The split:
SQLite holds energy intervals, SMART readings, tariff rates and collector health
Small JSON snapshots carry live state and collector handoff
What it admits it does not know
A stale reading that looks live is worse than no reading
Where that shows up:
An attention panel that leads with whether collectors are current, before any number
Collector health tracked in the database alongside the data it collects
I treated AI like an orchestra. I composed the system: what each collector should listen for, how the parts should work together, and what counted as trustworthy. AI helped me build, test, and debug faster. I made the calls and kept tuning the result against the real machines.
The SSH connection was fine. My safer key returned one field fewer than the parser expected.
The GPU panel went blank, and I blamed SSH. The connection was healthy. The restricted key returned 11 CSV fields; the parser expected 12 and discarded the reading. I fixed the parser, kept the safer key, and added a regression test for that exact shape.
What I locked down
Where AI helped, and where it did not
I treated AI like an orchestra. I decided what each part needed to do and how the pieces should work together. It helped me draft small collectors, look for security problems, and think through failure cases. I still tested every result against the actual Pi and network and rewrote anything I could not explain.
Where the security work ended up:
Runs as an unprivileged pi-dashboard user under systemd hardening
Credentials moved out of the application folder, and root-only checks separated from the web service
GPU SSH keys restricted to a single command
Dashboard state kept on the Pi’s internal storage, never on the external NAS backup drive
The number tells me now. The shape tells me whether now is normal.
The trend strips stay wide and short so spikes are easy to spot. A temperature of 63°C means more when I can see whether it has been flat all day or climbed in the last few minutes.
CPU load, temperature, and network activity keep their own scales so one quiet metric cannot flatten the rest.
Turning GPU draw into a dollar amount is where the estimate can get dishonest.
The Pi samples each GPU over SSH, turns those readings into watt-hours, then applies the local electricity tiers. I show a range because missing samples, changing tariffs, and board power all limit how exact the number can be.
How the measurement works
One-minute samples, accumulated into watt-hours
A restricted SSH key runs a single nvidia-smi command against each GPU. What comes back is power draw in watts at that instant. Sampled every minute and integrated over time, that becomes energy, and energy is the thing you can put a price on.
The chain:
One-minute samples written to SQLite as energy intervals
Intervals summed into watt-hours per day, then priced against the tariff
Why it is a range, not a number
A single figure would be more satisfying and less true
What the estimate includes and excludes:
Tier 1 at 7.065¢/kWh and Tier 2 at 11.142¢, both shown with 14.975% tax applied
The 46.154¢ daily system access charge is excluded, because GPU use does not cause it
It covers GPU board power only. It is not a whole-home meter and does not claim to be
Keeping the inputs honest
The tariff is data too, and data goes out of date
An estimate is only as current as its assumptions. The rate the dashboard prices against is checked against the official source monthly, and every change is recorded with both the date it took effect and the date it was detected. Those are not the same date.
How gaps are handled:
A missing reading renders as a gap, never as a zero
I would keep the honesty and fix the gaps.
The last 30-day window showed 73.2% coverage, and I still have not found why some samples disappear. The NVMe SMART parser also needs its own path, alerts need to push, and the Pi needs a watcher of its own.
I would keep the decision to show gaps instead of smoothing them over. The dashboard is useful because it admits what it knows, when it last checked, and where the estimate stops.
Thank you.